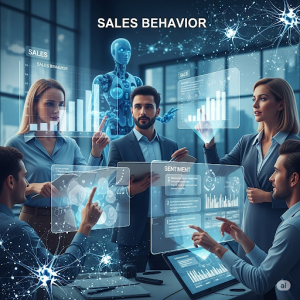
Role of Sales automation using AI for better sales, with practical examples
 About This article
- We know that there is a need for a definitive playbook for integrating artificial intelligence across every stage of the enterprise sales process to eliminate manual operational friction. This is discussed in detail in this article. It could be called the Enterprise AI-Integrated Execution B2B Sales Playbook.
- The playbook that helps us navigate the sales process for gains! It also leverages purpose-built AI tools such as (i) “6sense” for intent tracking, (ii)”Lavender” for psychographic-based prospecting.
- iii) “Gong” for live conversational intelligence, and iv) “Ironclad” for automated redlining of contracts to automate data enrichment. We also aim to hyper-personalize outreach, provide real-time meeting coaching, and shorten proposal turnaround times.
- This integrated pipeline transforms raw market signals into a predictable automated eco-system, taking tedious administrative tasks off the sales force :)! Also, ensuring pristine customer data from initial discovery through post-sale handoff is done by the machine or AI.
- The overall goal is to remove friction from manual workflows and replace it with automated, data-driven execution, so the sales executive can be nothing but a high-value advisory consultant!
 Phase 1: Territory Planning & Discovering the Tendencies to Buy
- Manual territory mapping and Static account scoring are not popular now. Dynamic market intelligence. Now, in the modern methods, intent tracking of the results is used. AI software constantly reviews the internal CRM history and external global buying signals, coordinates both to detect accounts that are entering buying windows or could buy.
- These tools are used to find anonymous intent signals, behaviors based on website traffic, and data on company hiring. ZoomInfo Copilot is an AI-powered sales agent and workspace that leverages ZoomInfo’s rich B2B database with one’s first-party CRM and engagement data.
- It automates prospect research, scores target accounts, tracks buying signals, and generates personalized outreach, all to help sales teams focus on closing deals instead of busywork. The two systems, 6sense and ZoomInfo, are independent but complementary platforms competing in the sales intelligence space.
- Automating persona or personal profile mapping and scraping of public financial data to scale data enrichment. Clay and Apollo.io
- are both top B2B sales and lead generation platforms — but for very different reasons. Apollo is an all-in-one execution platform (includes a built-in contact database and email outreach). Clay is a data and automation engine designed to pull deep insights and hyper-personalize outreach.
- Trigger intent data auditing is a rule-based, automated process of validating and evaluating a prospect’s online behavior before taking action. It’s a filter, separating the real, purchase-ready buying signals from the meaningless digital noise, so sales and marketing teams reach out at the perfect time.
- Set up your intent platform to look for specific high-value keywords (e.g., “legacy system migration,” “AI personality profiling”) in your target accounts. Filter for buying stage accounts that are either “Intense” or “Hot” only based on the keywords used.
- Utilize an enrichment workflow to extract high-intent accounts from the database. The system will automatically pull quarterly earnings statements, active job postings of targeted technical teams, and exact LinkedIn profiles of Tier-1 decision makers (i.e., CIO, VP of Sales Ops)- to connect, correlate, and predict where they are in the busy decision-making process. The cross-correlations of their above data are done internally by the software.
 3. Automated Matrix for Dynamic ICP Scoring CRM
- An automated dynamic Ideal Customer Profile (ICP) matrix is a system that evaluates and ranks CRM accounts in real-time. It assigns a score (usually 0 to 100) based on changing fit criteria (company size, tech stack, revenue) and buying intent, routing top-tier accounts directly to sales.
- The enriched profile is scored on a Propensity-to-Buy (P2B) scale and benchmarked against old closed-won models in the internal AI engine.
- “If they meet a certain threshold, then the accounts automatically get moved into the active pipeline of the Account Executive.” So, say for example if the P2B scale is 7/10 and one realizes that in the past conversions, anything at 7 or above means a successful closer, this account is taken to the active pipeline.
 Phase 2: Hyper-Personalized Prospecting & Outreach to Marketplace
Cold outreach is no longer a generic, automated bulk emailing process, but a high-context, persona-specific messaging process, instantly generated by a semantic analysis of corporate data.
Tool Stack Integration.
• Lavender / Regie.ai –
Phase 2: Hyper-Personalized Prospecting & Outreach to Marketplace
Cold outreach is no longer a generic, automated bulk emailing process, but a high-context, persona-specific messaging process, instantly generated by a semantic analysis of corporate data.
Tool Stack Integration.
• Lavender / Regie.ai –
- Outbound prospecting is automated by Regie.ai, a sales engagement platform (SEP) driven by artificial intelligence. It integrates human salespeople with generative AI agents into a unified workflow. While directing high-value accounts to human representatives( as Human Intelligence can handle them better), the platform manages repetitive operations, including lead discovery, data enrichment, sequence creation, and automated dialing.
- These tools are used for generative email personalization, text architecture scoring, and behavioral psychology analysis.
- Although these tools focus on entirely distinct business needs, 11x.ai and Lindy.ai are two of the top platforms in the “AI Employee” and autonomous agent market. Lindy.ai functions as a comprehensive, no-code platform for creating custom AI assistants to automate daily processes and executive administrative activities, whereas 11x.ai is solely focused on automating enterprise go-to-market (GTM) and outbound sales teams.
- Execution Framework Outbound [AI Reads 10-K( 10,000) Report & LinkedIn Activity] -> [Lavender software Drafts Email based on DISC Profile] -> [AE Review] -> [Send] -> [Target Contact]
- So in one case, the Persona’s Strategy that the AI is trained to use is a “Dominance” (D-type) style with an operational executive. So the focus of presentations or talks to the customer is based on ROI figures, saving time and bottom-line efficiency, and skipping the usual opening small talk. So, by doing this, there is a higher chance of success.
- One’s sales engagement tool detects a dip in efficiency in the latest quarterly earnings of a target company, associates it with a particular buyer personality, and instantly generates a 3-sentence email describing how your product addresses that exact risk.
 Phase 3 Discovery & Core Tech Alignment
- Live interaction intelligence replaces manual note-taking, capturing every customer sentiment, unvoiced objection, and structural requirement in real-time and matching it against case studies.
- Integration of Tool Stack.
- It is a leading AI-powered revenue intelligence platform for B2B sales and revenue professionals. It captures customer interactions from emails, video calls, and phone calls, uses AI to analyze them, and provides data-driven insights to help companies close more deals, coach their sales reps, and forecast revenues
- Live conversation intelligence with real-time objection pop-ups and sentiment trend mapping is done .
- It is an AI-powered sales assistant built for B2B sales and revenue teams. The aim is to automate administrative work and provide actionable intelligence so sales reps can spend less time doing “sales admin”—like CRM updates and follow-ups—and more time selling.
- To scan visual non-verbal cues, facial expressions, and track engagement of enterprise decision makers on video calls.
- Real-Time Live Coaching Matrix is a system often seen in contact centers, elite sports, and fitness. It employs AI or data analytics to provide real-time feedback and track performance on an ongoing basis.
- Action AI Detection Live Call Event Instant AE Playbook Cue Competitor Name Mentioned Detects competitor vendor name. A battle card pop-up with one’s key differentiators and a relevant case study. Hesitation in Pricing: Vocal hesitation or pitch drops in the voice. Suggests shifting from flat fee to phased and value-based implementation models. So this adaptiveness helps.
- So if there is low visual attention, highlight 3 or more buyers who are disengaged or on mute. Alert AE to halt the slide presentation and ask a direct, open-ended question.
 Phase 4: Justification of High Yield Value & Bespoke Design
- If one wants to justify the high yield value and the bespoke design, then one needs to show that premium, tailor-made solutions deliver a superior return on investment (ROI) by solving unique operational problems, maximizing efficiency, and reducing long-term costs
- Specialized document parsing intelligence does the heavy lifting of drafting custom proposals, building ROI calculators, and writing security reviews.
- Integration with Toolset
- SmartRecruiters is an enterprise-grade cloud platform that makes it simple for companies to manage the entire hiring process. Owned by SAP, it combines an Applicant Tracking System (ATS), Candidate Relationship Management (CRM), and recruitment marketing tools into one platform. It automates the workflow, uses AI to screen candidates, manages interviews, and digitizes offers to make it easier for global companies to hire.
- It is used for reading complex Requests for Proposals (RFPs) and matching them to past successful proposals.
- Notion AI is an integrated artificial intelligence assistant that is built directly into the Notion workspace. It’s designed to be a co-pilot that’s always by your side — brainstorming, drafting, editing, summarizing, and looking for info in your documents, tasks, and databases, without jumping between apps
- It used to mine internal whitepapers for enterprise business cases of relevance.
- Automated proposal process is the use of software and artificial intelligence (AI) to create, manage, and deliver business proposals or RFP (Request for Proposal) responses with little human involvement. It eliminates time-consuming manual copy-pasting and formatting in favor of streamlined, technology-driven workflows.
- So on the software front, when discovery is complete, the AE feeds secure internal AI engine transcripts and technical requirements. Then the system cross-references prior successful enterprise deals and, in 90 seconds, spits out a full and highly accurate draft of a customized technical proposal and business case, reducing proposal turnaround times.
 Phase 5: Procurement, Closing and Legal Review
- In the final stage, corporate deals often get bogged down in legal and procurement bureaucracy. This phase can take a long time, but AI can audit contract variances automatically.
- Both Ironclad and Icertis are leading software platforms within the Contract Lifecycle Management (CLM) category. They use AI and workflow automation to help businesses create, negotiate, sign, and track contracts, but they cater to different business needs and user types.
- AI-enabled contract lifecycle management is there, risk scoring and automated redlining.
- DocuSign CLM (Contract Lifecycle Management) is an enterprise software platform that automates the entire contract process from drafting and negotiation to execution, storage, and renewals. It removes manual bottlenecks and mitigates risk across legal, sales, and procurement teams. It helps to pinpoint procurement bottlenecks.
 Phase 6: Post-sale handover & growth governance
- Post-sale handover & growth governance is the framework that takes a new customer from the sales team to the fulfillment or customer success (CS) team. It brings to life sales promises and sets the operating rules for continuing management, retention, and growth of that account.
- So it starts from handoff from a closed-won deal to customer success, has to be seamless, so there’s a great foundation to grow the account and upsell down the road.
- Gainsight and Totango are two of the top Customer Success (CS) software platforms. They’re designed to help subscription and SaaS (Software as a Service) businesses track customer usage of their products, prevent users from churning(To prevent user churn, you need to put systems in place to prevent your current customers from cancelling subscriptions, migrating to a competitor, or ceasing to use your product or service altogether.), and find upsell and account growth opportunities. Both tools use customer data to generate a “health score” and initiate automated actions for account managers. Yet they vary in complexity and target audience. Automate customer health scoring, sentiment analysis, and predict account churn or expansion patterns. </li 1 ?? playbook The Power Transfer Playbook
- The AI system distills the entire historical sales cycle, including all emails, call transcripts, and legal negotiations, into a short, one-page “Customer Intent and Implementation Directive.” Customer Success Managers participate in the first kickoff meeting with knowledge of the client’s long-term business roadmap, so there is no need to ask the client to repeat their goals.
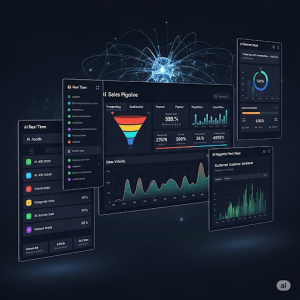
- Executive Summary AI Sales Pipeline Ecosystem
- [6sense / Clay] –> [Lavender / 11x] –> [Gong / Sybill] (Territory & Propensity) (Hyper-Prospecting) (Live Meeting Intelligence) v [Gainsight / Totango] <– [Ironclad / CLM] <– [Restaura / Notion AI] (Handover & Upsell Focus) (Automated Redlining) (we have the Custom Proposal Blueprint)
- conclusions Conclusion:
- AI is doing the structural data load. AI is transforming the sales pipeline by automating the extraction, cleaning, and ingestion of unstructured data (call recordings, emails, notes, etc.) into structured CRM formats.
- This removes manual data entry, reduces admin burdens, and gives real-time pipeline accuracy”, the back-end research, the admin compliance, the predictive forecasting. One’s only work is to learn to master the face-to-face boardroom execution, to read the interpersonal team dynamics, and to develop deep, unassailable value-based human relationships.
- So, at the end, what does this mean? The real value of AI in enterprise sales is not about replacing human interaction, but amplifying it with data-backed backend efficiency! Automating data entry, contract reviews, pipeline forecasting, and research allows sales executives to perform at their highest potential as strategic, high-value consulting partners.
- This new age, or say AI onwards, sales will be about a clear division of labor. AI will do the heavy lifting of operations and computation! The sales professional will be solely responsible for reading boardroom dynamics, conducting flawless negotiations, and building unassailable, trust-driven human relationships. So, in a sense, human interactions have increased.

- TRY SALES Enhancer for FREE Now!!!
 Please SELECT only the TRIAL REPORT option and NOT the DEMO Report as given in the image above on the form
CHECK TRIAL SALES & Customer Relationships Enhancer report CLICK HERE
For paid reports , you can kindly contact us at abioanalytics@gmail.com
OR simply fill up the form:
Key Benefits of Our Sales Enhancer Solution CLICK HERE
To know how SALES People could Use DISC Framework to Scale their SALES significantly? CLICK HERE
Please SELECT only the TRIAL REPORT option and NOT the DEMO Report as given in the image above on the form
CHECK TRIAL SALES & Customer Relationships Enhancer report CLICK HERE
For paid reports , you can kindly contact us at abioanalytics@gmail.com
OR simply fill up the form:
Key Benefits of Our Sales Enhancer Solution CLICK HERE
To know how SALES People could Use DISC Framework to Scale their SALES significantly? CLICK HERE
- TRY SALES Enhancer for FREE Now!!!
Please SELECT only the TRIAL REPORT option and NOT the DEMO Report as given in the image above on the form
CHECK TRIAL SALES & Customer Relationships Enhancer report CLICK HERE
For paid reports , you can kindly contact us at abioanalytics@gmail.com
OR simply fill up the form:
 Other SALES ARTICLES


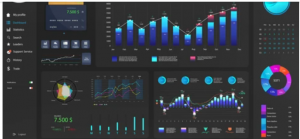
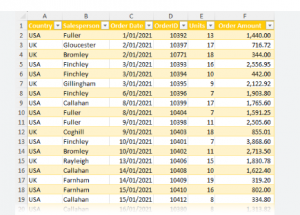 But AI doesn’t just present a table!
 It instead creates a multi-layered chart that overlays regional performance with lead source attribution.
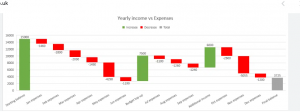 The AI then generates a Waterfall Chart (A waterfall chart is a type of data visualization that shows the cumulative effect of positive and negative values on an initial value to arrive at a final result.
)that visualizes the evolution of the deal value and a Heat map that visualizes which technical requirements are still “red” or not fulfilled.
This could be very intuitive and fill the gaps for quicker and clearer actions.
The AI then generates a Waterfall Chart (A waterfall chart is a type of data visualization that shows the cumulative effect of positive and negative values on an initial value to arrive at a final result.
)that visualizes the evolution of the deal value and a Heat map that visualizes which technical requirements are still “red” or not fulfilled.
This could be very intuitive and fill the gaps for quicker and clearer actions.


 Example 2: The supply chain and production in the industrial field